Dictionary
Drodzy czytelnicy.
Na tej stronie znajdziecie objaśnienia pojęć, których znajomość jest naszym zdaniem są niezbędna, aby z sukcesem inwestować na giełdzie. Zachęcamy was do częstego powracania do słowniczka w celu odświeżania wiedzy lub gdy traficie na nieznane Wam pojęcie w naszych artykułach.
Aby ułatwić nawigację, z boku strony znajdziecie spis treści — wybranie na nim pojęcia przewinie stronę do jego objaśnienia.
Commitment of Traders (COT)
What is COT (Commitment of Traders)?
This is a report prepared by CFTC (Commodity Futures Trading Commission), which shows the net position (long – short = net) held by individual participants of the futures markets in the United States. Data is collected every Tuesday and then published on Friday at 9:30 a.m. US time.
For the purposes of the report, market participants were divided into 3 groups: “Commercial Traders”, “Non-commercial Traders” and “Non-reportable Traders”.
Commercial Traders are considered the most competent and important group. They are mostly investment banks and manufacturers who want to protect themselves in the event of a drop in the prices of their products.
Non-commercial Traders, also called “Large Speculators”, are primarily investment funds.
Non-reportable Traders (Small Speculators) are a group with positions so small that they are not required to report them to the CFTC. It consists mainly of small speculators and retail traders. According to popular opinion, this is the worst-informed group on the market, referred to as dumb money.
When reading the COT report, we have insight into the positions of individual groups, but the most important thing is to capture how the size of their positions has changed over time. Therefore, the best approach to COT analysis is to use a chart.
How to interpret a COT chart?
Look below the gold price chart. The red line indicates Commercial Traders’ net position; green – Large Speculators; blue – Small Speculators. The net position is the difference between the size of long and short positions of a given group.
If the number of long positions exceeds the number of short positions, the group is net long. In turn, when the short position is greater than the long position, the group maintains a net short position.
The most important thing in the analysis is the net position represented by the Commercial Traders group. The chart shows how the extremely low value of short positions among Commercials coincides with local price lows (blue zone).
To summarize, the above COT chart can be interpreted as follows: Over the last 5 years, the low level of net short positioning among Commercials has informed us that a breakout in the gold price is expected.
COT is therefore an indicator that helps predict turning points in individual markets with high precision.
In most cases, the following rule applies: the higher the red line, the more bullish Commercials are on a given asset, and the greater the chances of its price increasing.
Short Squeeze
What is Short Squeeze?
Short Squeeze is a situation in which heavily shorted stocks increase in price and push investors out of position.
For example, let’s say that 50,000 people are shorting Tesla. Every tenth of them has a stop-loss order set at $310. Now let’s assume that the stock breaks through that level, and therefore 5,000 people close their shorts, which means they have to buy back those shares.
As a result, the shares automatically shot up, breaking through the next levels and forcing other investors out of their positions, for example at $315 or $320. Everything happens on a domino effect.
A short squeeze can also occur in commodity markets. An example of this is the situation that occurred with nickel prices in March 2022. The effect of the short squeeze can be seen in the chart below.
Yield Curve
What is the Yield Curve?
The yield curve is a graphical representation of the relationship between bond yields and their maturity date. All bonds are considered here, ranging from 1 month to 30 years.
The yield on short-term bonds depends largely on interest rates, while the interest rate on long-term bonds is also heavily influenced by expectations of future inflation. It is assumed that the interest paid by long-term bonds should be higher than on short-term bonds. Where does this relationship come from? Simply, if someone agrees to invest money for a longer period of time, the compensation for the risk associated with this investment should be higher interest. The opposite situation, in which short-term bonds pay higher interest rates, is a very disturbing phenomenon called inverted yield curve (red line).
Now let’s look at a graph that shows both curves.
We experience a normal yield curve most of the time when the economy is growing without problems. The inverted curve occurs much less frequently and is a very important signal for every investor. It is considered a reliable indicator that signals a coming recession and, consequently, a decline in the stock market.
Most analyzes most often use a simplified version of the yield curve, which is obtained by subtracting the yield on 2-year bonds from 10-year bonds. If we get a positive value (higher than zero), we are dealing with a normal yield curve. However, if the value is negative, it means that the yield curve is inverted.
Let’s check what this relationship looked historically and how a drop in the value below 0 effectively signaled a recession – marked with gray boxes on the chart.
As you can see, inverted yield curve have been warning us about every recession in last 70 years.
What is Gold-to-Silver ratio?
The Gold-to-Silver Ratio is calculated by dividing the price of one ounce of gold by the price of one ounce of silver. The result tells us how many ounces of silver we can buy for an ounce of gold at a given moment.
Thanks to the Gold-to-Silver Ratio, we can check at any time whether gold is expensive or cheap in relation to silver. To determine this, the current value of the indicator must be compared with historical data.
The best solution is to use a chart. It is assumed that when the value of the index falls below 40, we have cheap gold. If its level exceeds 70, silver looks more attractive.
Margin Debt
What is Margin Debt?
Margin Debt tells us how much credit was taken to purchase shares.
As the stock market rises, more optimistic investors decide to borrow money to profit from rising stock prices. In turn, during declines, investors sell shares to repay the loan. This causes Margin Debt to be positively correlated with stock prices.
The chart below shows Margin Debt (red) and quotations for the S&P 500 index in the United States (blue).
It is much more reliable to compare the Margin Debt level to the GDP. Historically, during the crises of 2000 and 2008, this percentage was both above 2%. Currently it is 2,3%.
(By the way: Look at the big spike during the stock market rally after covid-19.)
The higher the value of this indicator in relation to GDP, the more skeptical we should be about further increases in the stock market.
It is worth noting that during the last two bear markets, the level of Margin Debt in relation to GDP dropped to around 1.2 – 1.4%. Then there was a rebound and a new bull market began. For investors, this indicator may be one of the clues suggesting the lowest level during bear market.
P/E (Price-to-Earnings ratio)
What is P/E (Price-to-Earnings ratio)?
P/E (price to earnings) is an indicator calculated by dividing the company’s share price by its earnings per share (EPS). It can help us determine whether a given stock is expensive or cheap.
Example:
ExxonMobil shares cost $104,01.
Earnings per share for the last 12 months is $10,07.
P/E = $104,01 / $10,07 = 10.33
To put it very simply, the P/E ratio determines how many years we would have to wait for a return on invested capital, assuming that the company would paid us 100% of its profit. Of course, companies do not pay out profits in full, but the income accumulated in the company translates into a higher share value.
The above example shows that the purchase of ExxonMobil shares will pay off in less than 11 years.
It happens that earnings per share data is unavailable. Then we can calculate the P/E ratio in a different way. First, we calculate the company’s market capitalization (number of shares x share price), and then divide it by the accumulated net profit from the last 4 quarters.
At what P/E level do expensive stocks start? Opinions on this subject are divided. Our proposal on how P/E should be interpreted is as follows:
P/E < 5 (great opportunity)
5 < P/E < 8 (cheap shares)
8 < P/E < 16 (neutrally valued shares)
16 < P/E < 20 (expensive shares)
P/E > 20 (speculative bubble)
A useful tool if we want to compare the P/E level for individual stock exchanges around the world is the website https://worldperatio.com/.
In the case of the United States, these values are slightly higher, while for other markets, the criteria above can be adopted.
P/E Shillera (CAPE)
What is Shiller P/E (CAPE)?
Shiller’s P/E (also known as CAPE) is an indicator that is created in the same way as P/E but takes into account companies’ profits for the last 10 years.
To calculate it you must:
- Calculate the sum of a company’s earnings for the past 10 years.
- Adjust the historical earnings for inflation.
- Calculate the average of the inflation-adjusted earnings for the past 10 years.
- Divide the current share price by the average annual earnings.
CAPE provides us with a much higher level of confidence than P/E. The usual price-to-earnings ratio can be distorted by fluctuations in company earnings in a given year. In the case of CAPE, this problem does not exist because we are taking into accounts profits from the last 10 years.
CAPE can be used to compare the valuations of individual companies and entire stock markets.
A useful tool if we want to compare the CAPE level for individual stock exchanges around the world is the website https://indices.cib.barclays/IM/21/en/indices/static/historic-cape.app
Thanks to it, we can compare CAPE charts between individual markets and quickly check which stock exchanges are currently considered undervalued.
Our proposed interpretation of the CAPE indicator is as follows:
CAPE < 5 (great deal)
5 < CAPE < 8 (cheap shares)
8 <CAPE < 16 (neutrally priced shares)
16 < CAPE < 20 (expensive shares)
CAPE > 20 (speculative bubble)
P/BV (Price-to-Book Value ratio)
What is P/BV (Price-to-Book Value ratio)?
P/BV (price by book value) is an indicator that compares the share price of a given company with its book value, i.e. the value of assets less liabilities.
Assets include real estate, movable property, cash, patents and intangible assets. In turn, liabilities include debts to contractors, credits and loans.
Example:
ExxonMobil shares cost $104,01.
The book value per share is $50,39.
P/BV = $104,01 / $50,39 = 2,06
When analyzing P/BV, you should be aware that its level also depends on the specific nature of the company. In the case of raw material companies (high value of equipment, buildings, etc.), the P/BV ratio is usually from 0.4 to 2. The situation is completely different, e.g. when analyzing biotechnology companies (fewer tangible assets), where the P/BV level usually fluctuates from 4 to 20.
When it comes to P/BV for individual markets, we can use value for the ETF for a given country. We can find it on the ETF issuer’s website.
The lower the P/BV level, the more attractive a given stock exchange is. However, as with any other indicator, you should not base your decisions solely on it. When comparing markets in terms of P/BV, it should be remembered that the stock exchange, e.g. in South Korea, is characterized by a much larger share of technology companies, therefore in its case the level of 1.5 is normal, while in countries based on raw materials (e.g. Russia) this is a very high result.
P/S (Price-to-Sales ratio)
What is P/S (Price-to-Sales ratio)?
P/S (price to sales), is an indicator that compares the price of a given company’s share to the amount of revenues attributable to it. It is one of the most difficult indicators to manipulate. Below is the level of the P/S ratio in the USA in the years 1990-2022:
P/S can be calculated in two ways:
1. Share price / Value of revenues per share.
2. Enterprise value / Revenues for the last 12 months.
The higher the level of the indicator, the more expensive is the company compared to its revenues.
ETF
What is an ETF?
An ETF (Exchange Traded Fund) is a fund that tracks a particular market or industry. The vast majority of ETFs are listed on exchanges in the United States, and their diversity means that we can gain exposure to even the most exotic markets through them.
Example:
The ETF known as CARZ gives us exposure to the automotive industry. By buying units of the fund, we automatically invest in many companies that produce cars. If such an ETF did not exist, the investor would have to buy shares of many companies separately, which would increase their transaction costs. In the case of an ETF, they pay a commission only once.
One of the main advantages of ETFs is that they do not seek to outperform the average of a given market or industry. Such a strategy would involve a very high number of transactions and the employment of a large number of managers, which would quickly translate into significantly higher costs. As ETFs are passively managed funds, the costs of maintaining exposure are very low. In the case of the cheapest ETF, it is lower than 0.1%, while the average level ranges between 0.4% and 0.7% per year. For comparison, actively managed funds often cost clients an average of 1-3%.
In addition to traditional ETFs, there are also inverse ETFs, which allow you to bet on declines, and ETFs with built-in leverage mechanism.
Bond price and yield
What is the difference between bond price and yield?
Let’s assume that you bought 10-year bonds with a yield of 10% for $100. Therefore, you will receive interest of $10 per year, and after 10 years the issuer will return the borrowed amount, i.e. $100.
Now let’s assume that a year has passed, interest rates have been lowered and inflation has decreased. Issuers who not long ago had to offer 10% interest can now easily raise capital from the market by offering only 5% (after all, inflation is lower, so the value of the currency falls more slowly). Remember, however, that you are in possession of bonds that will pay out as much as 10% annually for the next 9 years. Your bonds are much more valuable at this point and capital will flow to them.
Notice that the yield of the bonds has fallen (from 10% to 5%), which has caused the price of your bonds to rise (in this example from $100 to $135). When the yield of bonds rises, the prices of bonds fall (ETFs on bonds as well). And vice versa.
Very often, this relationship appears with changes in interest rates, which in turn respond to inflation.
High inflation = interest rate increases = higher bond yields = lower bond prices.
Low inflation = lower interest rates = lower bond yields = higher bond prices.
The relationship described is presented in the graphic below:
Money and currency
What is the difference between money and currency?
Money and currency share many common features, which is why these terms are often used interchangeably. Is it right? – the table below provides the answer.
As you can see, the currency lacks one very important feature, which is the ability to store value over a long period of time. Value should be understood as purchasing power, as explained by the following example:
Let’s imagine that we have a banknote with a denomination of 100 units of currency X.
Let’s assume that at this moment we can purchase the following basket of goods for our banknote:
a) 2 breads
b) 1 kg of flour
c) 1 kg of groats
d) Butter
e) Book
A moment later, a pool of freshly printed currency hits the market. To simplify our example, assume that the quantity of goods in the economy has not changed. When there is an increase in the supply of currency, the natural reaction is to increase the prices of goods. In such a situation, we are able to buy fewer products with the banknote we have, for example:
a) 1 bread
b) 1 kg of flour
c) Butter
The smaller amount of goods in the basket is the effect of the decline in the purchasing power of the currency in our possession. The average lifespan of a currency is 27 years. Currency collapses usually have one and the same cause: as individual states become indebted, their governments, instead of cutting spending, decide to print more money. This leads to inflation, which is a kind of hidden tax (it reduces the purchasing power of our savings). Politicians decide on this solution because society does not feel inflation from day to day, but it is a process spread over years. The ultimate effect is always the same: inflation eventually turns into hyperinflation and the currency collapses.
In turn, gold or silver, which have all the characteristics of money, are available in limited quantities, which means they retain their purchasing power for years. Gold and silver have played the role of money for thousands of years and for some people they still do so. Let us add that after the reprinting carried out in 2008-2018, central banks themselves became much more willing to buy gold.
In conclusion, on the one hand, we have a currency whose value is based solely on trust in its issuer, and on the other hand, money, which is supported by a long history and the ability to store purchasing power. Placing a sign of equality between money and currency is most often the result of using mental shortcuts, so it is worth knowing the key difference between them.
Dodruk
Czym jest dodruk?
BĘDZIE ZUPEŁNIE NOWY TEKST OD MARCINA!!!
Jest to raport sporządzany przez CFTC (agencja regulująca rynek kontraktów terminowych w USA), który przedstawia, jaką pozycję netto (long – short = netto) utrzymują poszczególni uczestnicy rynków kontraktów terminowych w Stanach Zjednoczonych. Dane zbierane są w każdy wtorek, a następnie publikowane w piątek o godzinie 21:30 czasu polskiego.
Na potrzeby raportu, uczestników rynku podzielono na 3 grupy: „Commercial Traders”, „Non-commercial Traders” i „Non-reportable Traders”.
Commercial Traders są uznawani za najbardziej kompetentną i najważniejszą grupę. W ich skład wchodzą przede wszystkim banki inwestycyjne oraz producenci chcący zabezpieczyć się na wypadek spadku cen ich produktów.
Non-commercial Traders, zwani również „Large Speculators” to przede wszystkim fundusze inwestycyjne, których skuteczność jest ograniczona, przez czynniki opisane przez nas w artykule „Czy warto inwestować poprzez fundusze inwestycyjne”.
Non-reportable Traders (Small Speculators) to grupa posiadająca na tyle małe pozycje, że nie ma obowiązku zgłaszania ich do CFTC. W jej skład wchodzą głównie mali spekulanci oraz traderzy detaliczni. Według powszechnej opinii, jest to najgorzej zorientowana grupa na rynku, określana jako dumb money.
Czytając raport COT mamy wgląd w pozycje poszczególnych grup, ale najważniejsze jest, aby uchwycić, jak zmieniała się wielkość ich pozycji na przestrzeni czasu. Dlatego najlepszym podejściem do analizy COT jest skorzystanie z wykresu.
Jak interpretować wykres COT?
Bezpośrednio pod powyższym wykresem ceny złota, linią czerwoną oznaczono pozycję netto Commercial Traders; zieloną – Large Speculators; niebieską – Small Speculators. Pozycja netto, to różnica między wielkością pozycji long oraz short danej grupy.
Jeżeli liczba pozycji long przewyższa liczbę pozycji short, to dana grupa ma pozycję netto long. Z kolei, gdy pozycja short jest większa od pozycji long, to grupa utrzymuje pozycję netto short.
Najważniejsza w analizie jest pozycja netto reprezentowana przez grupę Commercial Traders. Na wykresie widać, jak ekstremalnie niska wartość pozycji short wśród Commercials zbiega się w czasie z lokalnymi dołkami cenowymi (patrz – fragmenty zaznaczone na błękitno).
Podsumowując, powyższy wykres COT można interpretować następująco: W ostatnich 5 latach niski poziom pozycji netto short wśród Commercials informował nas o tym, że należy spodziewać się wybicia ceny złota.
COT jest zatem wskaźnikiem, który pomaga z dużą precyzją przewidzieć punkty zwrotne na poszczególnych rynkach. Na blogu odnosiliśmy się do niego przy okazji artykułu „Update na rynku złota i srebra”.
W większości przypadków obowiązuje następująca zasada: im wyżej znajduje się czerwona linia, tym lepsze jest nastawienie Commercials do danego aktywa i również większe szanse na wzrost jego notowań.
What is inflation?
What is inflation?
Definition of inflation is one of the most manipulated in the world of broadly understood finance. For a long time, inflation was defined as an increase in the amount of currency circulating in economy, but everything changed after World War II, as a result of propaganda carried out by corrupted academic circles.
That true definition directly linked money printing with the phenomenon of price increases, while the current one focuses only on the effect (higher prices), completely forgetting about the cause (printing). It is important to be aware of both of these definitions.
As we have already mentioned, in the past, inflation was defined as an increase in the amount of currency in circulation. In 2006, the United States stopped publishing the M3 base, which accurately reflected the level of inflation (approx. 2% was subtracted from this figure to take into account the increase in productivity). The currently reported official inflation in the US has nothing to do with reality. Even FED representatives admit it.
In addition to the scale of currency creation, inflation is also influenced by the speed of money circulation (the faster money circulates in the economy, the stronger the price reaction). It can grow mostly in two cases:
1. The economic situation is very good, people are not afraid of losing their jobs and spending their money without any worries. Capital circulates quickly in the economy.
2. There is a fear that the value of the currency will decline and people try to get rid of it (mostly by changing it to the other currencies or gold).
Deflation
What is deflation?
Deflation was defined as a decline in the amount of currency in circulation but is now associated exclusively with falling prices. In addition to the scale of printing, deflation is also influenced by the speed of money circulation, so we can identify two cases:
1. Natural deflation resulting from increased productivity. Technological progress makes production cheaper. Different products are created at a lower cost and ultimately we all pay less for it.
2. Deflation resulting from the crisis. If society limits purchases, entrepreneurs are forced to lower prices.
In the case of natural deflation, its demonization is a common phenomenon nowadays. We are told that falling prices are dangerous because consumers postpone purchases, which slows down economic growth. This is nonsense. The best example is any kind of electronic devices (phones, laptops), whose prices are falling at a rapid pace. The real reason for this narrative is different. Deflation is the enemy of the current debt-based system. If we had deflation today, the level of debt would quickly become unsustainable, which would mean the collapse of the system, as well as the return to the gold standard. On the other hand, in an inflationary environment, debt is devalued and bankers can control situation.
What is a stock market crash?
A crash is a sudden drop in the price of a given asset (e.g. shares, gold, corn) listed on the stock exchange. A crash occurs when negative investor sentiment turns into panic and massive asset sales.
Example:
The chart below shows the Nasdaq Composite Index. It first shows the increase in share prices in the years 1995-2000, and then the beginning of the crash. What is characteristic of a crash is that the declines that accompany it are much more dynamic and last for a shorter time than the earlier phase of growth.
Differences between a bull market and a bear market
A bull market is a long-term period of rising asset prices on the stock market, accompanied by positive sentiment among market participants. A bear market is the opposite of a bull market and occurs when the upward trend in a given asset is broken by a decline of at least 20%.
A bear market also differs from a bull market in terms of time and dynamics. At the beginning of a bull market, only the so-called smart money, i.e. the most effective investors, are on the market. When stocks rise, institutional clients begin to buy them over time. Ultimately, rising prices attract crowds of people who do not know how to invest. At a certain point, capital stops flowing into the market and declines begin. The panic is so great that the declines progress at a rapid pace. As a result, a bear market always lasts much shorter than a bull market.
The difference in the course of a bull market and a bear market is illustrated by the following graph of the S&P 500 index.
As you can see, bull markets lasted significantly longer than the crashes that followed them.
An exception to the rule of bull and bear markets are sometimes commodities. During periods of rising commodity prices, there are concerns about their shortage, so the rises may be shorter and more volatile than the falls.
What is CFD (Contract for difference)?
Czym jest CFD (Contract for difference)?aWhat is CFD (Contract for difference)?
CFD is a special instrument that can be used in two ways: to trade on the upside and downside.
Trading on the upside:
It works similarly to buying regular stocks or ETFs. With one difference. CFDs have leverage, which allows you to invest with more money than you actually have.
Example: Let’s say the leverage for Apple stock is 1:10. We buy 10 shares of the company, each worth $200. We do this using CFDs. The total value of the purchased package is $2,000. However, only $200 (1/10 of the position value) is deducted from our account, and we borrow the rest from the broker, for which we have to pay interest. We therefore have $1,800 left, which we can invest in other assets or keep in cash.
Trading on the downside:
Here too, we are dealing with leverage, but we make money only when the asset we choose loses value. Important: When opening a position on the platform, we do not click “buy”, but “sell”.
We generally avoid leverage, so we only use CFDs for trading on the downside. The reason is simple: no other instrument offers this possibility.
IPO, ICO i ETO
What is IPO, ICO and ETO?
IPO (Initial Public Offering)
Initial Public Offering (IPO) is the first public offering of securities. Simply put, it means that a company is going public.
Prior to an IPO, a company is typically owned by a small group of shareholders (e.g., founders, family). As a result of the public offering, the company’s shares become available to a wider group of individual and institutional investors. This makes it easier to raise capital needed for business development, but at the same time, entering a regulated market (stock exchange) is associated with the obligation to comply with many rules imposed by the regulator (e.g. SEC in the United States).
Each IPO requires the preparation of an offering prospectus, a document that will contain details about the offering (e.g., development prospects, risk factors). In addition to the benefits of raising additional capital, IPO makes a company more recognizable and gains more credibility.
ICO (Initial Coin Offering)
Initial Coin Offering (ICO) is the process of raising capital for the development of projects related to cryptocurrencies. In most cases, ICOs are conducted by startups, which thanks to this form of financing can avoid many difficulties that arise in the case of traditional forms of financing (e.g., Venture Capital or banks). ICO takes place through the issuance of so-called Tokens, from the sale of which capital is raised.
Each ICO requires the creation of a so-called “whitepaper”, which is the equivalent of an offering prospectus. Whitepaper often also contains a so-called “roadmap”, which is a scheme outlining the next stages of project development.
ETO (Equity Token Offering)
Equity Token Offering (ETO) is a form of raising capital for companies through cryptocurrencies. It was created as an alternative to ICO, while maintaining the protection of shareholder interests similar to holding a security. Thanks to ETO, a company can issue its shares recorded on the blockchain. Each investor must first undergo authentication (KYC and AML procedure), only then can they purchase tokens that entitle them to make decisions at shareholders’ meetings or receive dividends.
How does the dollar affect the prices of commodities and precious metals?
Before we answer this question, it is key to understand what the Dollar Index is.
The Dollar Index (symbol: DXY) measures the value of the US dollar against a basket of six currencies: the euro (57.6%), the Japanese yen (13.6%), the British pound (11.9%), the Canadian dollar (9.1%), the Swedish krona (4.2%), and the Swiss franc (3.6%).
An increase in the index indicates a strengthening of the dollar against the basket of other currencies. Conversely, if the index falls, it means that the US currency is losing value. The chart below of the Dollar Index shows that in the second half 2020, the dollar clearly weakened, and then the trend changed.
For many years, there has been a strong inverse correlation between the dollar and commodity prices. A strengthening dollar is typically accompanied by falling commodity prices, while a weakening dollar is usually associated with a strong commodity market. Below you can see inverse correlation. Usually commodity index (CRB – blue color) and Dollar Index (green color) are moving in opposite directions.
The inverse correlation between the dollar and commodity prices is due to the fact that commodities are often priced in dollars. Producers set prices based on the exchange rate between their local currency and the dollar. Therefore, when the US dollar strengthens, it takes fewer dollars to buy a given commodity, and when the dollar weakens, the purchase of a commodity becomes more expensive.
REIT
What is REIT?
REIT (Real Estate Investment Trust) is a special fund that allows individual investors to invest in commercial real estate from various sectors (residential, industrial, retail, etc.).
There are three types of REITs:
Equity REITs invest in rental properties and earn income from them. This is a simple business model and this is how most REITs operate.
Mortgage REITs, as the name suggests, invest in mortgages. Their earnings depend primarily on the interest rate at which the mortgages are repaid. This type of REIT is significantly riskier than equity REITs.
Hybrid REITs are formed by combining equity and mortgage REITs.
Typically, individual REITs focus on single sectors (e.g. office buildings), so by investing in them, we can gain targeted exposure. However, there are also REITs that diversify their portfolio by investing in several sectors at once.
REITs are characterized by high dividends. This is due to the fact that they must allocate at least 90% of their earnings to shareholders (in some countries, at least 75%).
There is a wide selection of REITs on the market, which allows us to invest in real estate from all over the world. An investor from Europe can easily gain exposure to the real estate market in Hong Kong or Singapore.
Another important advantage of REITs is their liquidity – they can be bought and sold like stocks, practically at any time (it looks completely different when you own a house and try to sell it).
As for their disadvantages, they are not instruments without risk and sometimes have high management costs, which reduces profits or increases potential losses.
It is worth adding that, in addition to investing in individual REITs, it is also possible to buy ETFs on REITs.
P/FFO (Price-to-Funds From Operations)
What is P/FFO (Price-to-Funds From Operations)?
FFO, or funds from operations, is a financial metric that measures the amount of cash generated from a company’s core business operations. It is a more accurate measure of REIT performance than earnings per share (EPS), because it includes depreciation and amortization, but excludes gains from the sale of real estate.
How to calculate FFO:
FFO = (net income + depreciation and amortization) – gains from the sale of real estate – interest expense on loans and issued bonds
In practice, FFO shows how much money a REIT is making from renting its properties.
Example:
A REIT generates $100 million in rental revenue in the past quarter. The costs are $20 million. This means that the REIT’s net income for the quarter is $80 million. The REIT’s depreciation expense is $25 million and its amortization expense is $50 million. The REIT also sells a property for $40 million.
FFO = $80 million + $25 million + $50 million – $40 million = $115 million
Therefore, FFO is higher than net income ($115 million vs. $80 million). In the long run, FFO will always be higher than net income.
When calculating FFO, it is important to note that a REIT can acquire properties using debt. In this case, the company’s earnings over the next few years will increase, but its debt will also increase. This means that when analyzing a REIT using the P/FFO ratio, it is important to also consider whether the REIT’s debt is not growing at a significant pace.
How to calculate P/FFO ratio:
For example, if the price per share of a REIT is $100 and its FFO per share is $20, then the P/FFO ratio is 100/20 = 5. In a simplified way, this means that the REIT will generate as much money as its current valuation over the next 5 years. We can see that, in the case of P/FFO, as with P/E, the lower the value, the better.
While REIT issuers typically disclose FFO, it may be more difficult to find P/FFO ratio. This means that you will need to calculate it yourself or use a website that does it for you. Some websites that offer this service include gurufocus.com and seekingalpha.com.
EBITDA
What is EBITDA?
EBITDA is a measure of a company’s operating profitability, excluding the effects of financing and taxes. It is calculated as the difference between revenue and operating expenses, before deducting interest, taxes, depreciation, and amortization.
In other words, EBITDA measures how much money a company is making from its core business operations, before taking into account the costs of financing its operations or paying taxes.
What is liquidity?
Czym jest płynność?
Liquidity is a colloquial term referring to the scale of trading in a given asset over a given period of time. It answers the question of how much of an asset can be exchanged (sold or purchased) without significantly affecting its market price.
The most liquid asset is cash. We can exchange individual currencies on the forex market in very large quantities, at any time and without affecting exchange rates. The opposite is true for collectible assets – due to their low availability, it is very difficult to quickly sell, for example, a few rare watches, without significantly lowering the price. Even if we already lower the price, the sale may take us several days.
When investing on the stock exchange, we should look for assets with high liquidity. How do we check it? We analyze the volume, which is the number of shares that change hands in one day. Important: it doesn’t mean that we can just analyze one last trading day. It’s more reasonable to look at average volume per day, based on longer period of time. You can find it on different financial websites. They show volume from the last day but there is also an average volume based on longer period.
DeFi
What is DeFi?
Decentralized finance (DeFi) is a financial system built on blockchain technology that aims to eliminate the need for traditional financial intermediaries like centralized banks, brokers, and exchanges.
The DeFi industry is to be devoid of any central management entity (e.g. Central Bank) and any types of intermediaries in the form of commercial banks, brokers and insurers. The most important role here is played using blockchain technology, which would ensure shorter service delivery times, lower commissions and greater security. The first successes of DeFi are the creation of decentralized cryptocurrency exchanges. Despite the lack of regulation, they are used by millions of people around the world.
Forex
What is FOREX?
Forex is an abbreviation for Foreign Exchange Market, which simply means currency exchange market. The largest participants in this market are central banks, commercial banks, governments, and corporations. On the other hand, we ourselves also become participants in the forex market, even by making online purchases in foreign currency.
The importance of the forex market is best evidenced by the fact that daily trading volumes on it amount to around 6 trillion dollars. At the same time, the forex market is the most liquid market in the world.
Currently, there are around 180 different currencies in the world, but the most important of them is the US dollar. It is this currency that participates in the largest number of transactions. Right after it is the euro, and in the next places are the Japanese yen, British pound, Australian dollar, Canadian dollar, and Swiss franc.
The forex market can be used in several ways. The first is to mitigate currency risk, for example during business operations. When exporting a given product abroad, we receive payment in a different currency. Therefore, there is a risk that the exchange rate will change significantly to our disadvantage and negatively affect the margin of our company. By taking an appropriate position on a currency pair, we are able to secure our profit. The same applies to investments.
It is worth remembering about one more application of the forex market. It allows us to transfer our cash from more risky currencies to those that are considered to be the safest (the US dollar, the Swiss franc, and the Japanese yen). This is especially valuable in a situation when there is panic on the financial markets – then the currencies of developing countries lose value, and capital flows to those considered to be the most stable.
Despite all these applications, the forex market is most popular among speculators. This is all thanks to the availability of financial leverage, thanks to which the most effective traders are able to make money on forex. However, it is important to remember that about 80% of people lose their money on this market.
What is contango and backwardation?
On financial markets, we can purchase a futures contract with delivery of a commodity in the future (e.g., one month or one year). For example, this could be a corn contract with delivery in one year. Most likely, the price of the commodity in this situation will be higher than its current value. Why?
There are several reasons for this. If we want delivery in one year, the seller must store and insure the goods, which means there are costs. Additionally, the market may assume that the commodity will be more expensive in a year (at least due to inflation). All of this means that we will pay more for a corn contract with delivery in one year than the current price. This means that we are dealing with contango.
Let’s look at an example:
Corn costs $500 today. We want to buy a contract that expires in one year, but in this case the cost is already $540.
(540 – 500) / 500 = 8% -> this is the amount of contango.
In other words, contango determines how much the price must rise for us to break even. In the example above, we are buying corn for $540, and if the price of the commodity rises by 8% (from $500 to $540) then we will only break even.
For the investment to make us a profit, the price must rise by more than the mentioned 8%. Let’s assume that in the example above, corn rises to $600. Our profit will then be 11.1%. Why? We bought the contract for $540, and we earned $60.
60 USD / 540 USD = 11.1%
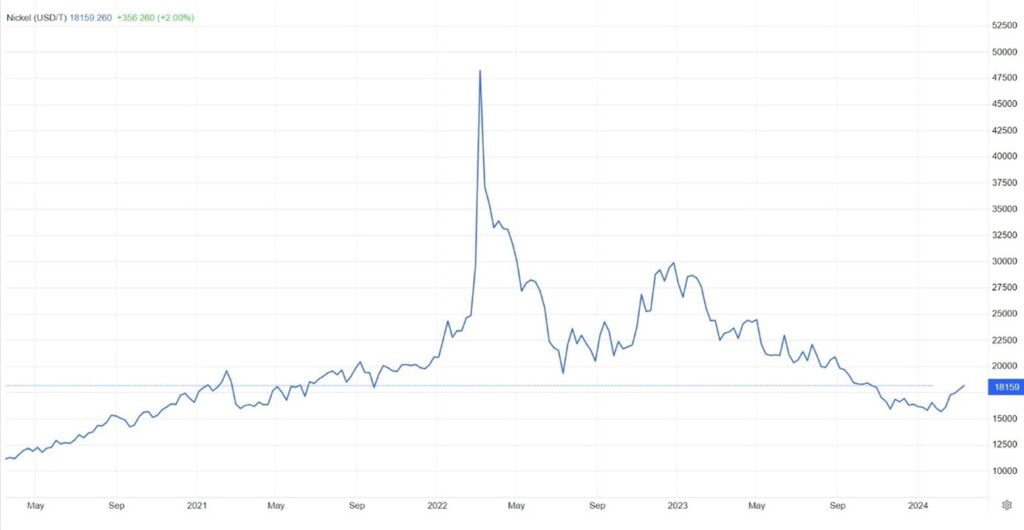
In the case of commodities, contango occurs in 80-90% of cases. This phenomenon is less visible in the market for industrial metals (contango is usually 1-3%). It has a somewhat stronger impact on agricultural commodities (3-10%). The highest contango is observed in the energy commodities market, especially in situations when their quotations are after strong declines. Such a situation turns out to be exceptionally dangerous for inexperienced investors.
However, it happens that contango not only does not occur, but in fact we are faced with the opposite situation. Delivery in one year is a cheaper solution than buying a commodity with delivery right now. How is this possible? There are situations in which, for example, there is a shortage of a particular commodity. In such a case, the seller may, for example, offer delivery of palladium today for $2,500, or delivery in one year for $2,000. It’s called backwardation effect.
(2000 – 2500) / 2500 = -20% -> this is the amount of backwardation.
Therefore, if we invest through contracts or ETN funds, we should remember about the effects of contango and backwardation. They can have a huge impact on the investment outcome.
What is insider trading?
Insiders are people associated with a given company – they can be both members of the management board, supervisory board, directors, and managers. The word “trading” refers to stock trading, so in the simplest translation, “insider trading” means a situation in which people working in a given company buy or sell its shares.
However, the phrase “insider trading” often appears in a negative sense and refers to a situation in which a person made a decision to buy or sell shares based on confidential information that is not available to other market participants. Such actions are illegal.
What is US Dollar Index?
The US Dollar Index (DXY) is a measure of the value of the US dollar relative to a basket of six foreign currencies: euro, Japanese yen, British pound, Canadian dollar, Swedish korona, and Swiss franc.
The index helps investors monitor the value of the US dollar against other currencies. It can be used as a kind of indicator. If it is at high levels, it means that the US dollar is strong against the other major currencies. The opposite is also true.
What affects the value of the index? The current supply and demand for the US dollar and the currencies that make up the basket. Monetary policy of a given country, including interest rates set by the central bank, plays a significant role. Other important factors include inflation, economic data, credit ratings, market sentiment, geopolitical situation, and swap agreements between central banks.
What is stagflation?
Stagflation is a combination of economic stagnation and high inflation. The most famous example of stagflation is the 1970s. In the early part of that decade, US President Richard Nixon severed the link between the dollar and gold, thereby weakening the American currency. At the same time, due to the embargoes imposed by Arab countries, the price of oil rose sharply. Companies therefore had to raise prices while at the same time reducing production (lack of the main transportation raw material).
During the COVID-19 pandemic, we experienced a similar situation. Prices rose due to the increase in the money supply and introduction of checks paid to millions of people. At the same time, production capacity shrank due to the lack of raw materials and disrupted supply chains. The effect was that inflation rose with limited GDP growth.
Stagflation makes it difficult for businesses to operate and also misleads investors. In the years 1968-1982, the nominal value of the Dow Jones Industrial Average remained at a very similar level. However, after taking inflation into account, it turned out that the real decline was as much as 75%.
What is CBDC?
What is CBDC?
CBDC, or Central Bank Digital Currency, is a digital currency issued by a central bank. It is a new form of digital money on accounts held at a central bank, issued solely by the central bank of a given country to serve as a legal tender. CBDC has nothing to do with cash and electronic money available today on accounts at commercial banks. Digital currency is also something completely different from cryptocurrencies.
Like cash today, CBDC is to be widely available and accepted in retail payments and is to serve primarily as a medium of exchange. It differs from physical money not only in its digital form, but also in the possibility of programming (for example, what the consumer can spend such funds on, until when etc.), thanks to the use of so-called smart contracts.
It is important to note that CBDC cannot be issued by commercial banks, but only by the central bank in a given country (such as the Bank of England, the Bank of Japan, or the European Central Bank in the case of eurozone countries). In addition, it always takes an electronic, not cash, form. Many documents from biggest financial institutions shows that CBDC can be the successor to cash. It’s very important as cash gives us more freedom and anonymity, where CBDC can take it from us.